
A layperson's guide to simulation error in chaotic systems
Or; hi, Mom! This is what my Ph.D. thesis is about.
My Ph.D. thesis– at the time of this writing– is being drafted, with the chapters currently being processed for publication. I want to, in this blog post, develop the basic ideas for a non-technical audience.
In my thesis, I study simulations of unpredictable systems, with the broad goal of making them as accurate as possible. This is made more complicated by the "unpredictable" part, and generally it's hard to distinguish between natural unpredictability and artificial errors. That's where my thesis work comes in– I develop a novel understanding of the nature of the error amidst the unpredictability, and then exploit that understanding for efficiency benefits.
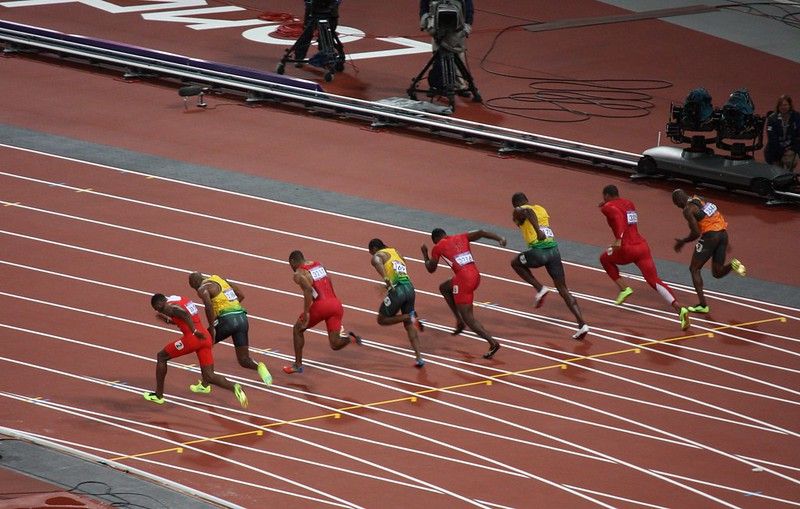
In order to dig into these ideas, let's consider a contrived analogy. Imagine that you have been hired by some sprinters who went on a vacation together. On their vacation, well, they raced each other at a local track, but there was a big debate over who won. Luckily there was a closed circuit camera system pointed at part of the track, but unfortunately it didn't cover the finishing straight, and– perhaps worse– it's old and can only output digital images onto a floppy disk. Because of the processing time, you can get one floppy disk per week, filled with images. You can send the facility requests for 1) how many pixels you want in each frame, 2) how many frames to send, and 3) how much of the race the frames should cover. Unfortunately, too, while you can request the length of the video, due to a technical snafu you can't specify what part of the race that clip comes from. The sprinters want you to figure out who was most likely to be the winner, and to return your determination in ten weeks.
So we want to find the winner– the person who crossed the finish line first. On a fixed-length track, whoever goes the fastest on average will cross the finish-line first. Since we can't recover video of the finish line, then we will want to figure out who had the highest average speed to make the best-possible guess of the winner.
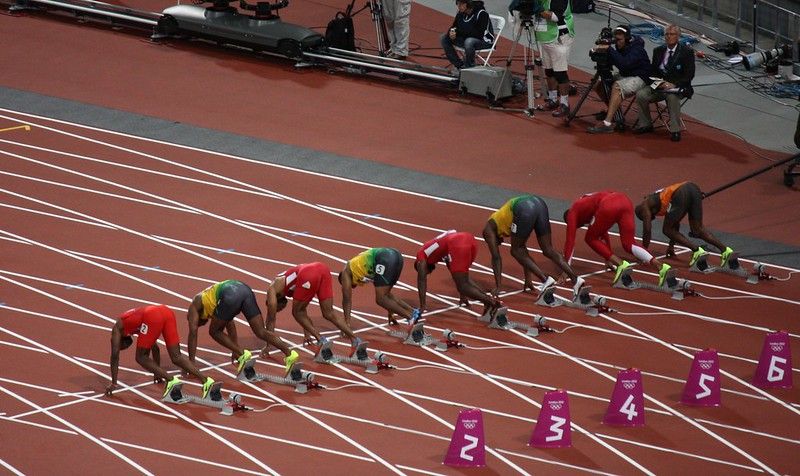
Now, we need to make the best possible estimates of the average speeds we need to make good choices about how we fill the floppy disk. The 3.5 in. floppy disk holds about 1.5MB. About five the highest-resolution image (with all pixels included) from the closed circuit camera, shown here, is approximately 300kB.
However, we can take blurrier copies of each frame to save space. This initial frame, for example could be requested with lower numbers of pixels, like in this gallery:
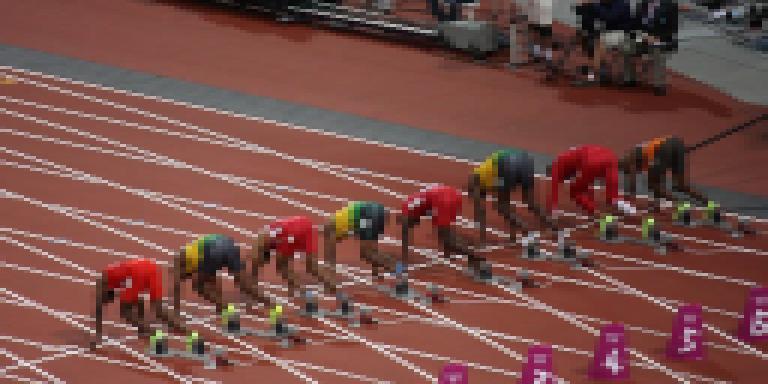


In the original high-resolution image, the sprinters' numbers are visible, they can be clearly identified, and their the most forward part of their body– which is what is timed– can be accurately described. As we reduce the number of pixels, at first, describing accurately where the runners are becomes harder, and with each reduction in pixels this gets increasingly hard to the point that eventually its impossible to distinguish the sprinters. But, where we can store five copies at the maximum resolution, we can store 90 of the first reduced version, 360 of the next, 1440, 5760, 23080, and so on. The key takeaway is simple: there is a fundamental relationship between the cost and the clarity of a given frame; more cost means a more clear picture.
If we choose a particular resolution, say the second reduced pixel image of which we can store 360 frames on the floppy disk, we now have to choose how long of the race the frames should cover. In the process, this also implies how long elapses between frames. A sample of full-res frames from the race are shown below.

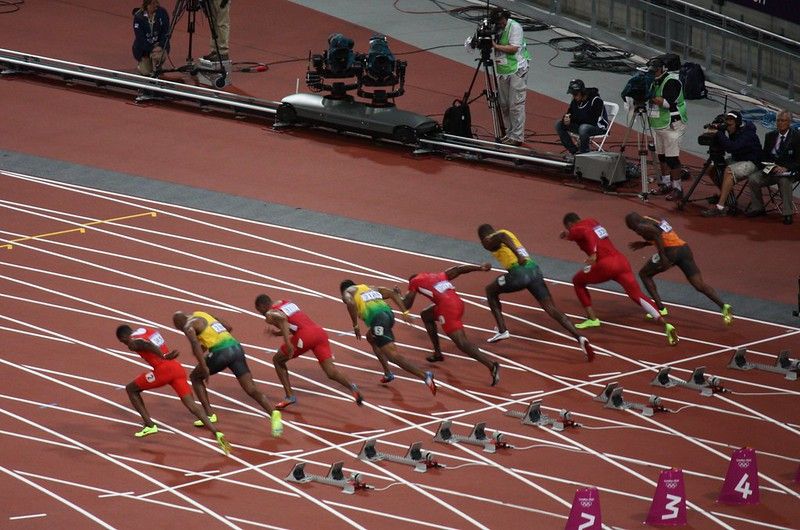
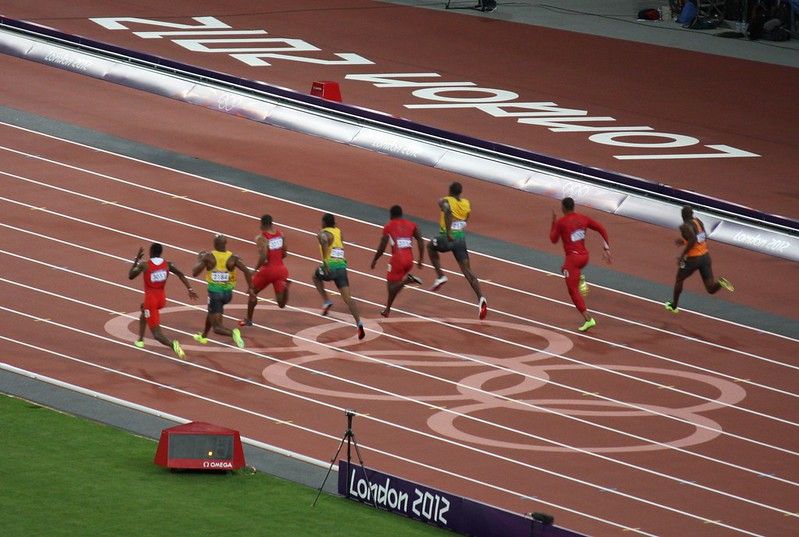
Sprinters, being human, don't run at a perfectly steady speed. Strides take variable lengths, and runner speeds undulate somewhat over the course of a race. If we take an over a long period of the race, the resulting average will be more representative of the true average (and more likely, then, to give the true winner!). Thus, the longer the averaging period the more accurate the average will be. On the other hand, the closer the frames are to each other the easier it is to distinguish the runners (especially if the frames themselves are blurry) and to track where the runners leading body parts are accurately. The closer the frames are to each other, the more accurate our estimates can be.
The big problem is that there's a tradeoff here. We want maximum pixels, maximum frames, and a maximized sampling time. On a single floppy disk, however, we have to balance how we use the available resources!
What does this have to do with simulations of physics?
Taking these ideas, we can look at simulation errors. Where in photographs, images get blurry when there aren't enough pixels, simulations can get blurry when they don't have a computational equivalent, which in my work are referred to as "elements" in finite element simulations. The big difference is that when you have pixels in a video frame, they don't affect what happens in the subsequent frames. In simulations of physics, "blurriness" is passed along in time: you can't go from blurry cause to clear effect, only blurry effect.
In a similar way, the frames being far apart also effects how accurate they are. Just like it's easier to shoot a coin that's five feet away than at 100 yards because there's more wind, more time for gravity to work, and– of course– it's harder to aim, simulations introduce errors when they have to jump further in time between "timesteps" which are our equivalent of frames in a video.
But even though these things operate in a different way, the principles are the same. We have finite numbers of computers that have finite speeds and we can run simulations only for finite times before we need results; like a floppy disk filled with frames of sprinters, this is a budget; with this budget we want to get the most accurate result we can.
My thesis work creates a model for these errors and the costs associated with the "elements" and "timesteps", our analogs for pixels and frames. If one imagines the settings of elements and timesteps one might use as a dartboard where the scoring rings have been removed and the only way to find out your scores is by asking a referee who knows the board by feel, you could say that the first contribution of my thesis is throwing a million darts to figure out the scoring distribution. The second big contribution is showing that, by smartly incorporating knowledge about how scoring patterns on a dartboard should work, we can hit the bullseye by incorporating scores one-at-a-time and in a correct fashion, within a few throws rather than a million.
Thanks a ton to flickr user sum_of_marc whose photo album (below) I use for images to support the above under his Creative Commons license.
